
Appearance
Overview & reports
The Overview is the administrators' first page: the whole installation at a glance for the last 7, 30 or 90 days. Each installed module adds its own figures — revenue and plans (SaaS), people and sign-ups, websites, recorded sessions, storage and AI — and every number is compared with the period before. Everything on the page downloads as one CSV, and the full list of users as another.
Where: sidebar › Administration › Overview (/admin). Only administrators can open it; the server answers everyone else with 403.
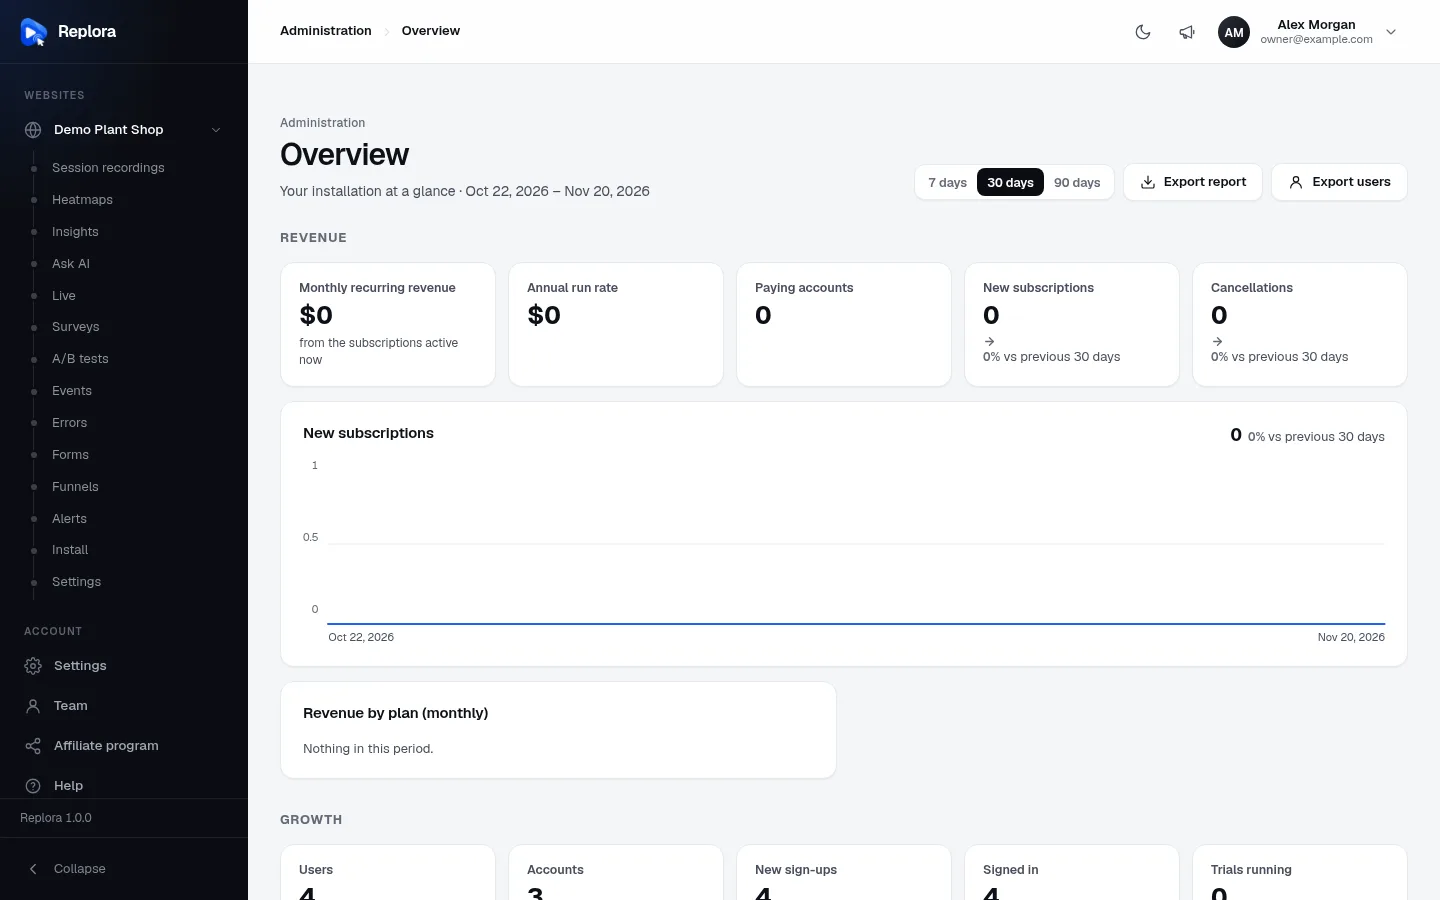
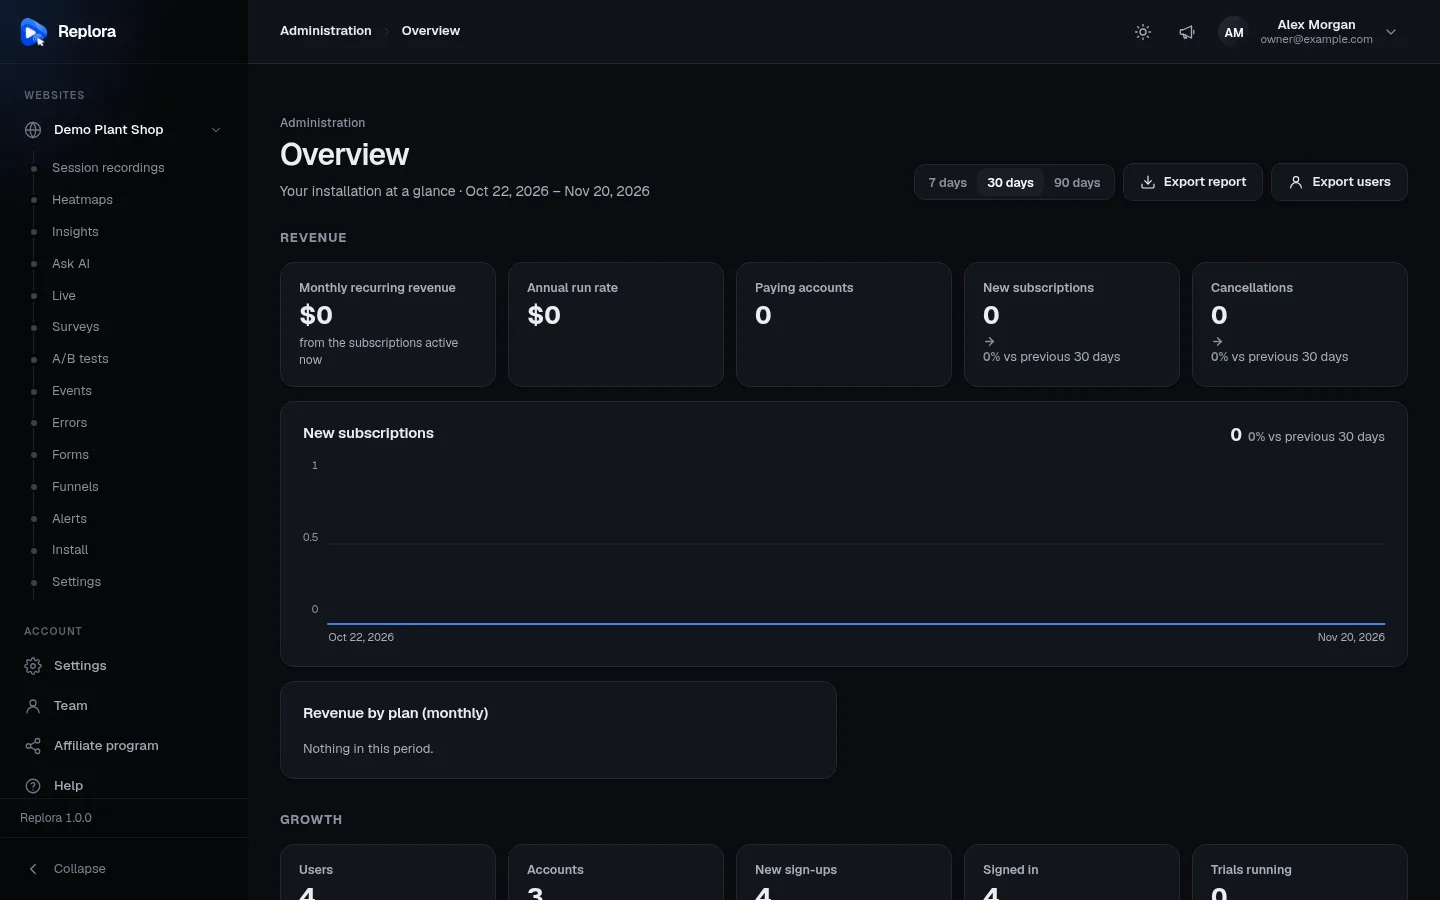
1. PeriodThe last 7, 30 (default) or 90 days, ending today, in your own time zone.
The period and the page header
| Control | What it does |
|---|---|
| 7 days · 30 days · 90 days | The period. Default 30 days. It ends with today and starts that many days back; days are counted in your time zone (Settings › General › Time zone), so "today" is your today. The subtitle shows the exact dates, e.g. Your installation at a glance · Oct 22, 2026 – Nov 20, 2026. |
| Export report | Downloads overview-<from>-<to>.csv with everything on the page for the chosen period (see The report CSV). |
| Export users | Downloads users-<date>.csv: every user with name, email, account, role, status, how they joined, dates and the module columns. Same file as Users › Export CSV with no filters. |
Both downloads are limited to 10 a minute per person.
How the numbers are shown
The page has up to three sections, in this order. A section appears only when some module has figures for it, so the Single user edition (no Plans module) has no Revenue.
- Tiles show a value. Most also show the change against the previous period of the same length (e.g. the 30 days before the 30 shown): an arrow up, down or flat and the change in percent, 0% vs previous 30 days. When the previous period was 0 and this one isn't, the change reads new. Tiles without a comparison (totals "right now", such as Users) show none.
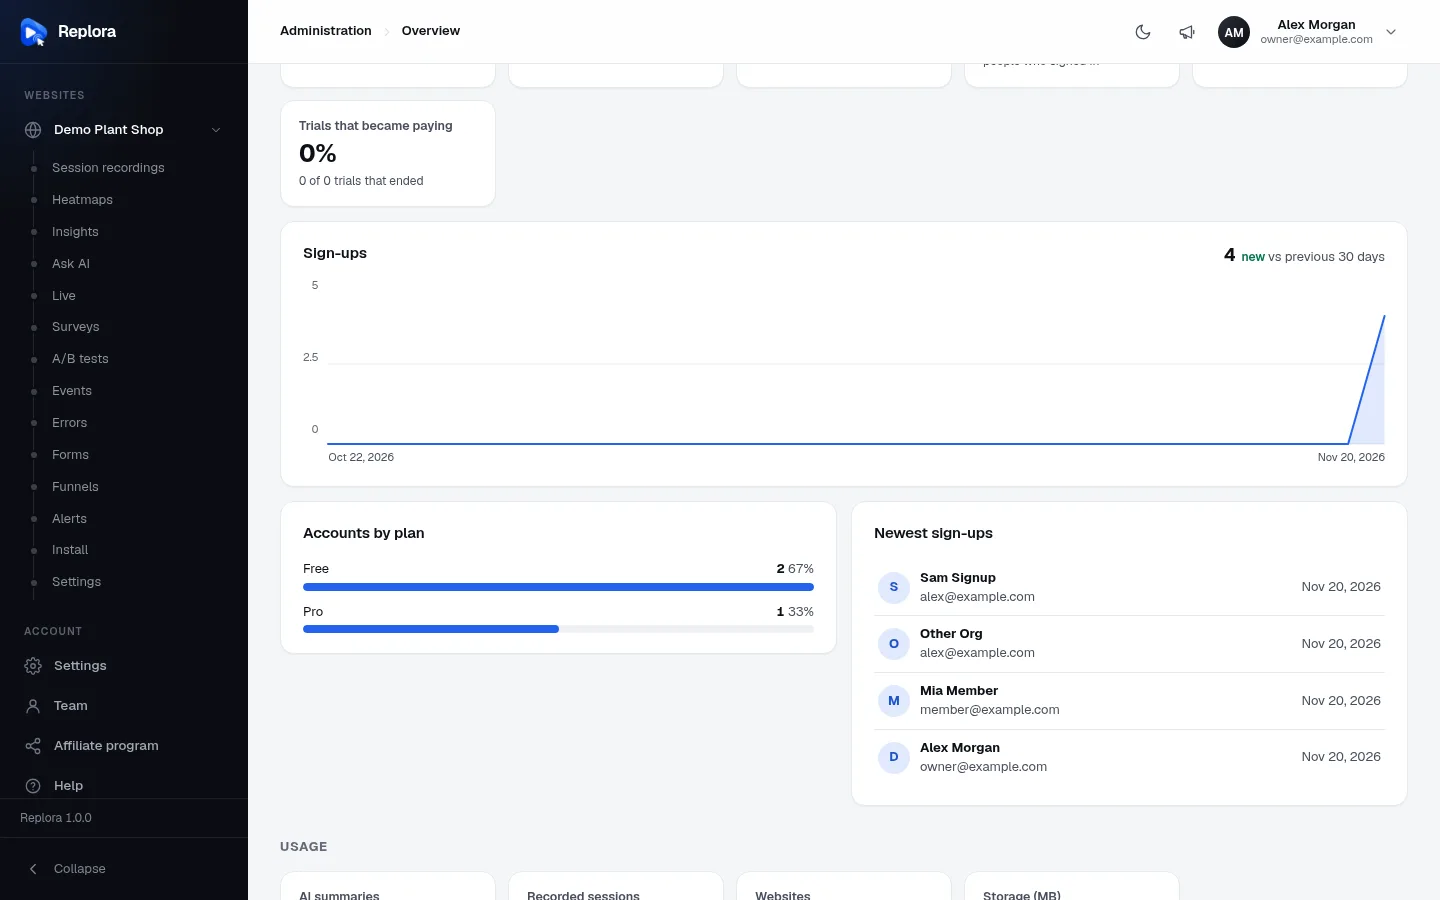
- Charts show one value per day, the period's total and its change, a round scale (1, 2, 2.5 or 5 × a power of ten) and the first and last date. Move the pointer over the chart for a crosshair and the day's value.
- Breakdowns list labelled values as bars, largest first, with each one's share in percent. Nothing in this period. when empty.
- Lists show short rows (for example the newest sign-ups); a row with a link opens it.
When nothing is installed that reports figures, or there is no data at all yet, the page says Nothing to show yet — Numbers appear here once people sign up and record.
Revenue SaaS
From the Plans module. Amounts are in the main currency: the currency of the first plan with a price (else of the first plan, else USD). Subscriptions in another currency are left out of the money figures.
| Figure | Kind | What it counts |
|---|---|---|
| Monthly recurring revenue | Tile | The monthly value of every subscription that gives access now, one per account (an account's dearest one). A yearly subscription counts as its yearly price ÷ 12. Hint: from the subscriptions active now. |
| Annual run rate | Tile | Monthly recurring revenue × 12. |
| Paying accounts | Tile | Accounts whose monthly value is above 0. Hint: average X a month (MRR ÷ paying accounts). |
| New subscriptions | Tile + daily chart | Subscriptions started in the period, compared with the period before. |
| Cancellations | Tile | Subscriptions that were cancelled or ended in the period, compared with the period before. |
| Revenue by plan (monthly) | Breakdown | Monthly recurring revenue per plan, rounded to whole units. |
INFO
Plans assigned by an administrator (Users › Change plan) count in the plan figures but bring no revenue: only real subscriptions from Stripe or Paddle are money.
Growth
From the core (people and accounts) and, on SaaS, the Plans module (trials and plans).
| Figure | Kind | What it counts |
|---|---|---|
| Users | Tile | Everyone who can sign in, now. Hint: N suspended. |
| Accounts | Tile | Accounts (organizations) now. One account can have several users. |
| New sign-ups | Tile | Users created in the period (any way: sign-up, invitation, installation), compared with the period before. |
| Signed in | Tile | People whose last sign-in falls in the period, compared with the period before. Hint: people who signed in. |
| Trials running SaaS | Tile | Free trials that haven't ended yet. |
| Trials that became paying SaaS | Tile (%) | Of the trials that ended in the period, the share of accounts that pay now. Hint: X of Y trials that ended. |
| Sign-ups | Daily chart | New users per day. |
| Accounts by plan SaaS | Breakdown | Every account by the plan it is on now (assigned, subscribed, trial, free plan, or No plan). |
| Newest sign-ups | List | The six newest users with email and date. Clicking one opens Users filtered to that email. |
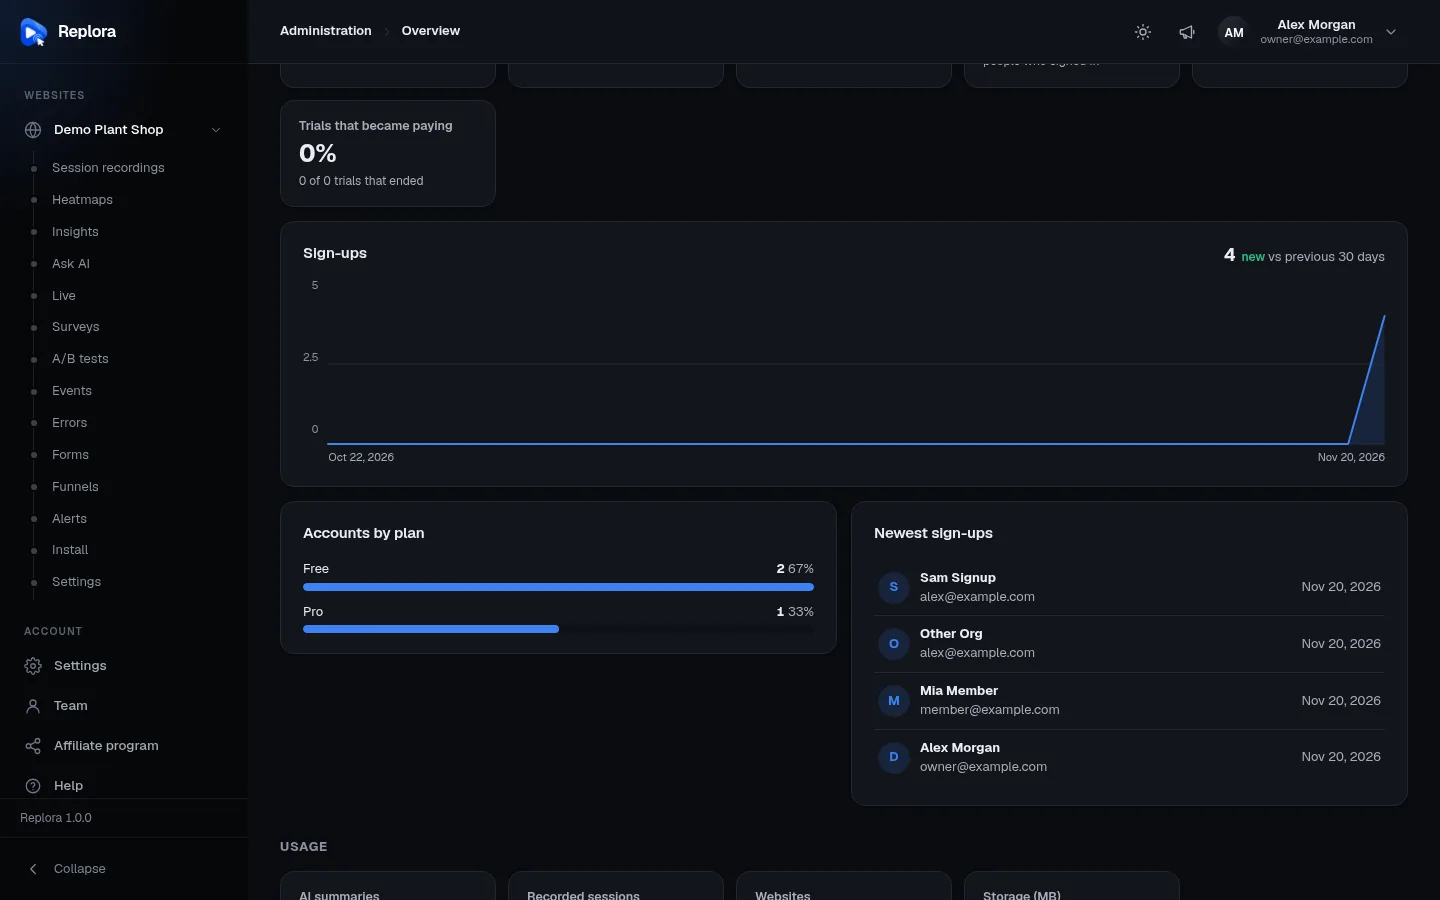
Usage
From the Recordings and Summaries modules.
| Figure | Kind | What it counts |
|---|---|---|
| AI summaries | Tile | Session summaries written (or rewritten) by Claude in the period, compared with the period before. Hint: N tokens (input + output tokens they used). See AI features. |
| Recorded sessions | Tile + daily chart | Sessions that started in the period, on every website of every account, compared with the period before. |
| Websites | Tile | Websites now. Hint: N recording in this period (websites with at least one session in it). |
| Storage (MB) | Tile | The size of all recordings kept now, in megabytes. |
| Busiest accounts | Breakdown | The six accounts with the most sessions in the period. |
| Devices | Breakdown | Sessions in the period by device: Desktop, Mobile, Tablet, Other. |
The report CSV
Export report writes one row per figure, with these columns:
| Column | Holds |
|---|---|
section | revenue, growth or usage |
part | stat (a tile), daily (one day of a chart), breakdown (one bar) or list (one row of a list) |
label | The figure's name as on the page, in your language |
item | The currency (stat), the date (daily), the bar's label (breakdown) or the row's title (list) |
value | The value (lists: the row's subtitle, e.g. the email) |
previous_period | The previous period's value, for tiles that have one |
note | The tile's hint, the breakdown's currency, or the list row's date |
Cells that start with =, +, - or @ get a leading ' so spreadsheets don't run them as formulas.
Read the Overview
- Open Administration › Overview.
- Pick 7 days, 30 days or 90 days.
- Compare each tile's arrow with the period before; hover over a chart to read single days.
- Click a name under Newest sign-ups to open that user on the Users page.
- Press Export report to work with the numbers in a spreadsheet.
Time zone
The day boundaries follow your own time zone. Two administrators in different time zones can see slightly different daily values for the same dates. Set yours under Settings › General › Time zone.
Related
- Users — the people behind the growth figures
- Plans & limits — the plans in the revenue figures
- AI features (Claude) — what the AI summaries cost
- Scaling to high traffic — when sessions and storage grow